It’s June 11th. June is when the flying season really kicks off, it’s also when my checkride schedule fills up fast. And in the first eleven days of this month, FAA preliminary data shows 78 general aviation accident and incidents across the United States. Here’s what the numbers look like.
June 1–11
June 1–11
June 1–11
Phase
Specifically
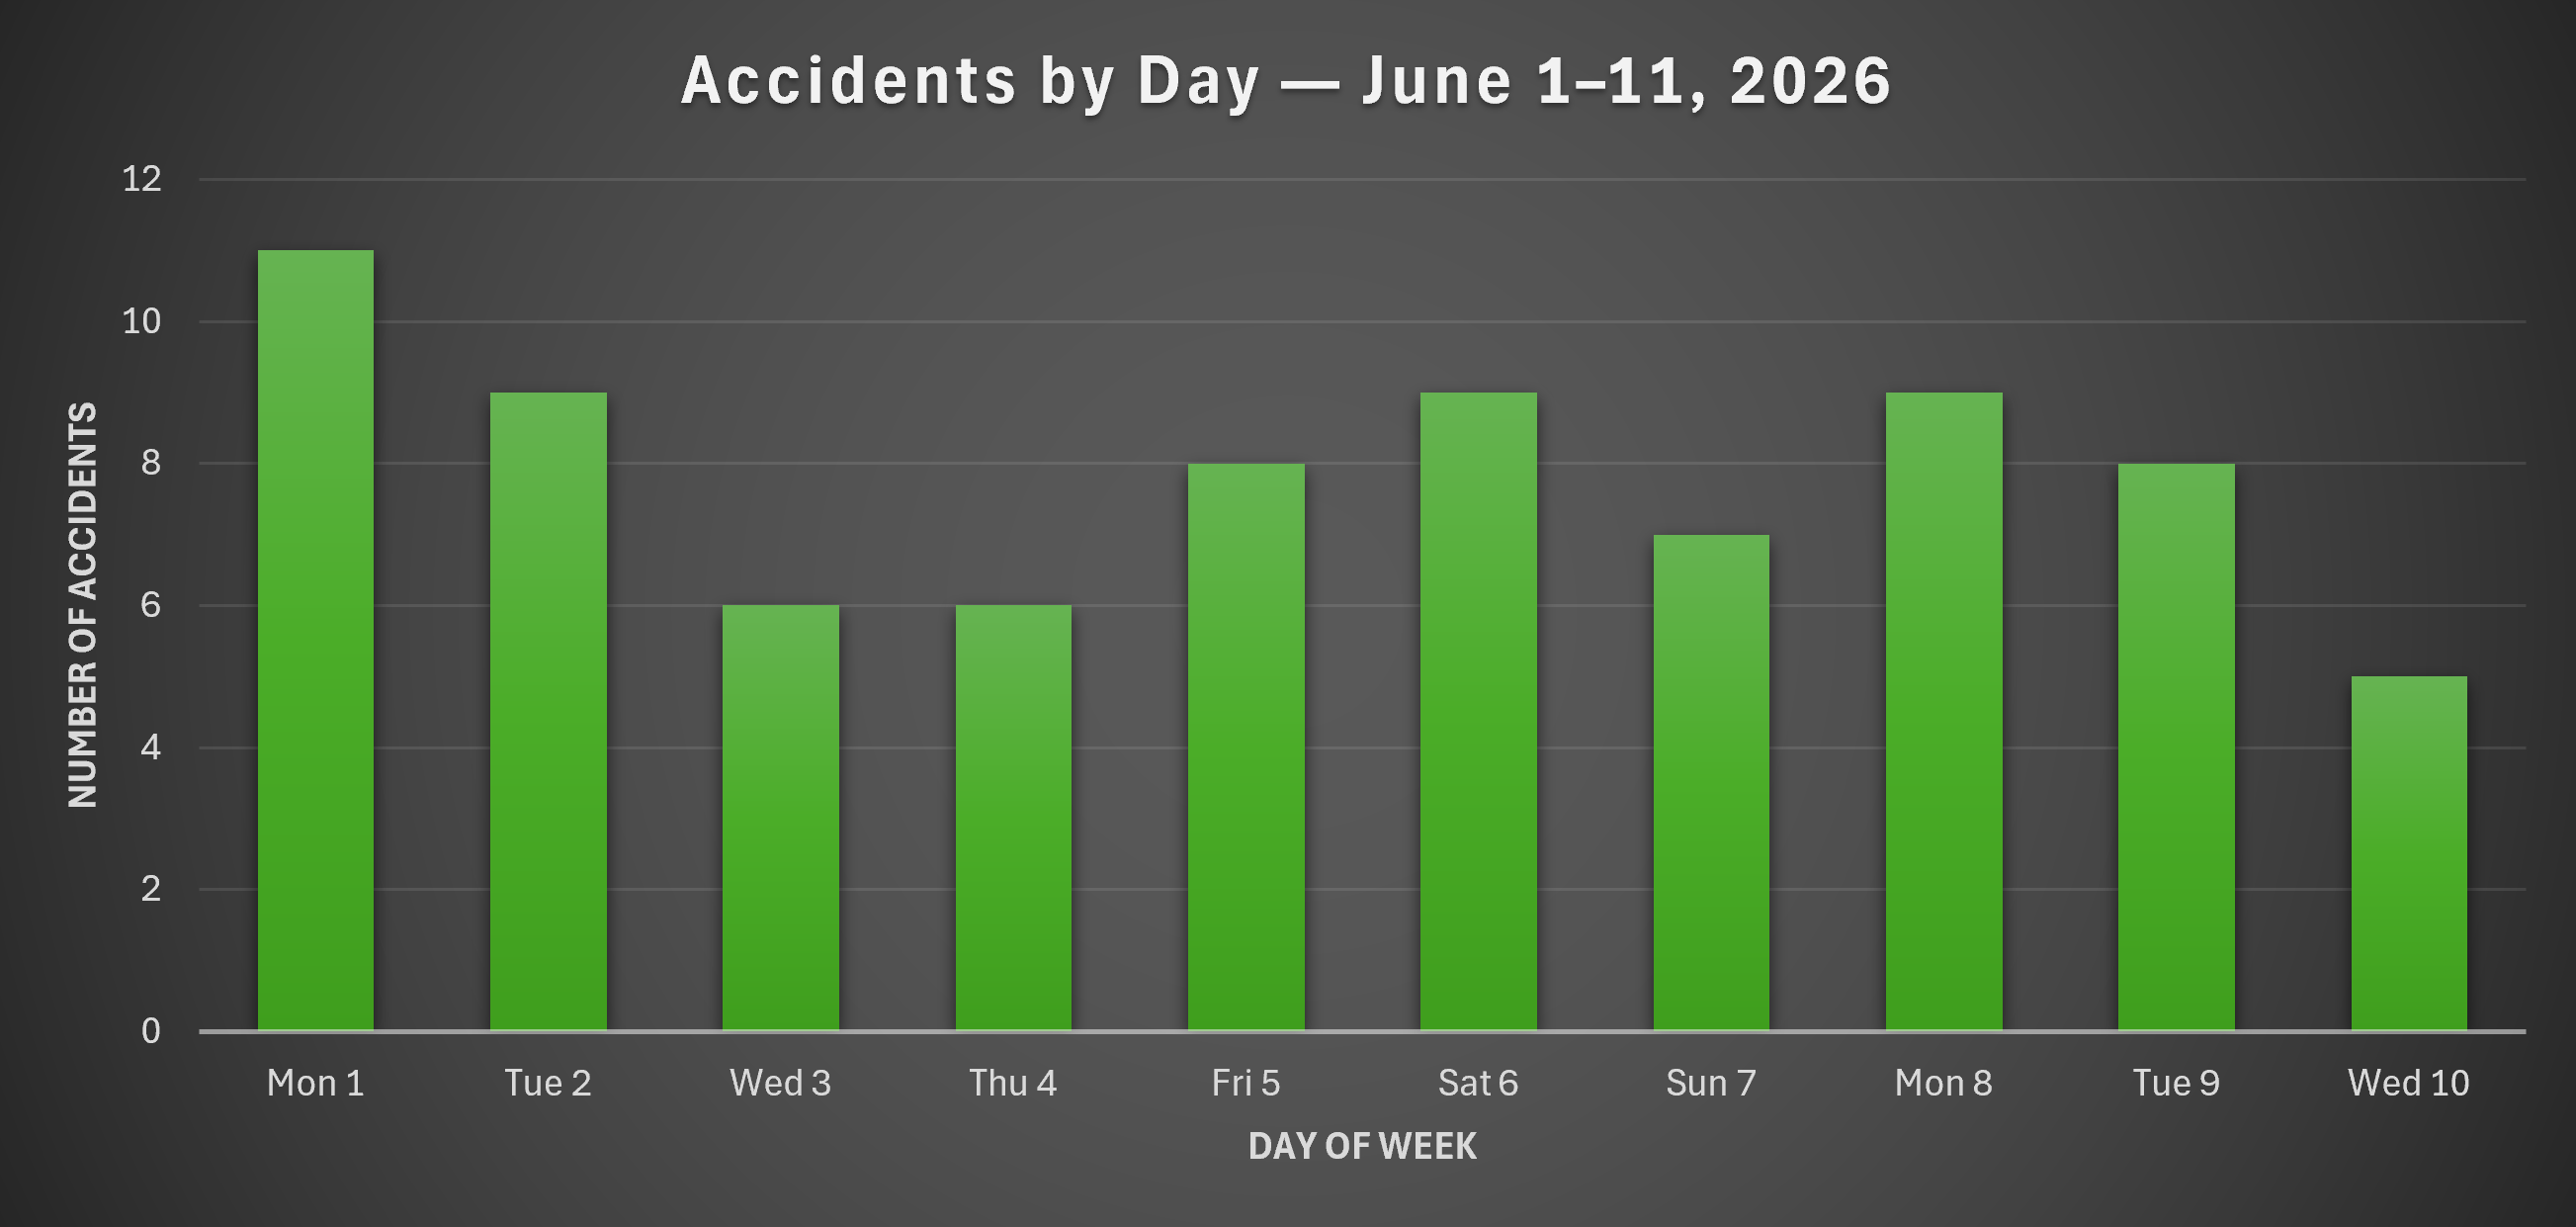
When Are Accidents Happening?
The first chart breaks accidents down by calendar day. There’s no dramatic single-day spike, accidents are distributed across the period, but Wednesdays show the lowest counts in this 11-day snapshot. Don’t read too much into one data point; the more useful signal is just how consistent the daily accident pace is throughout the week.
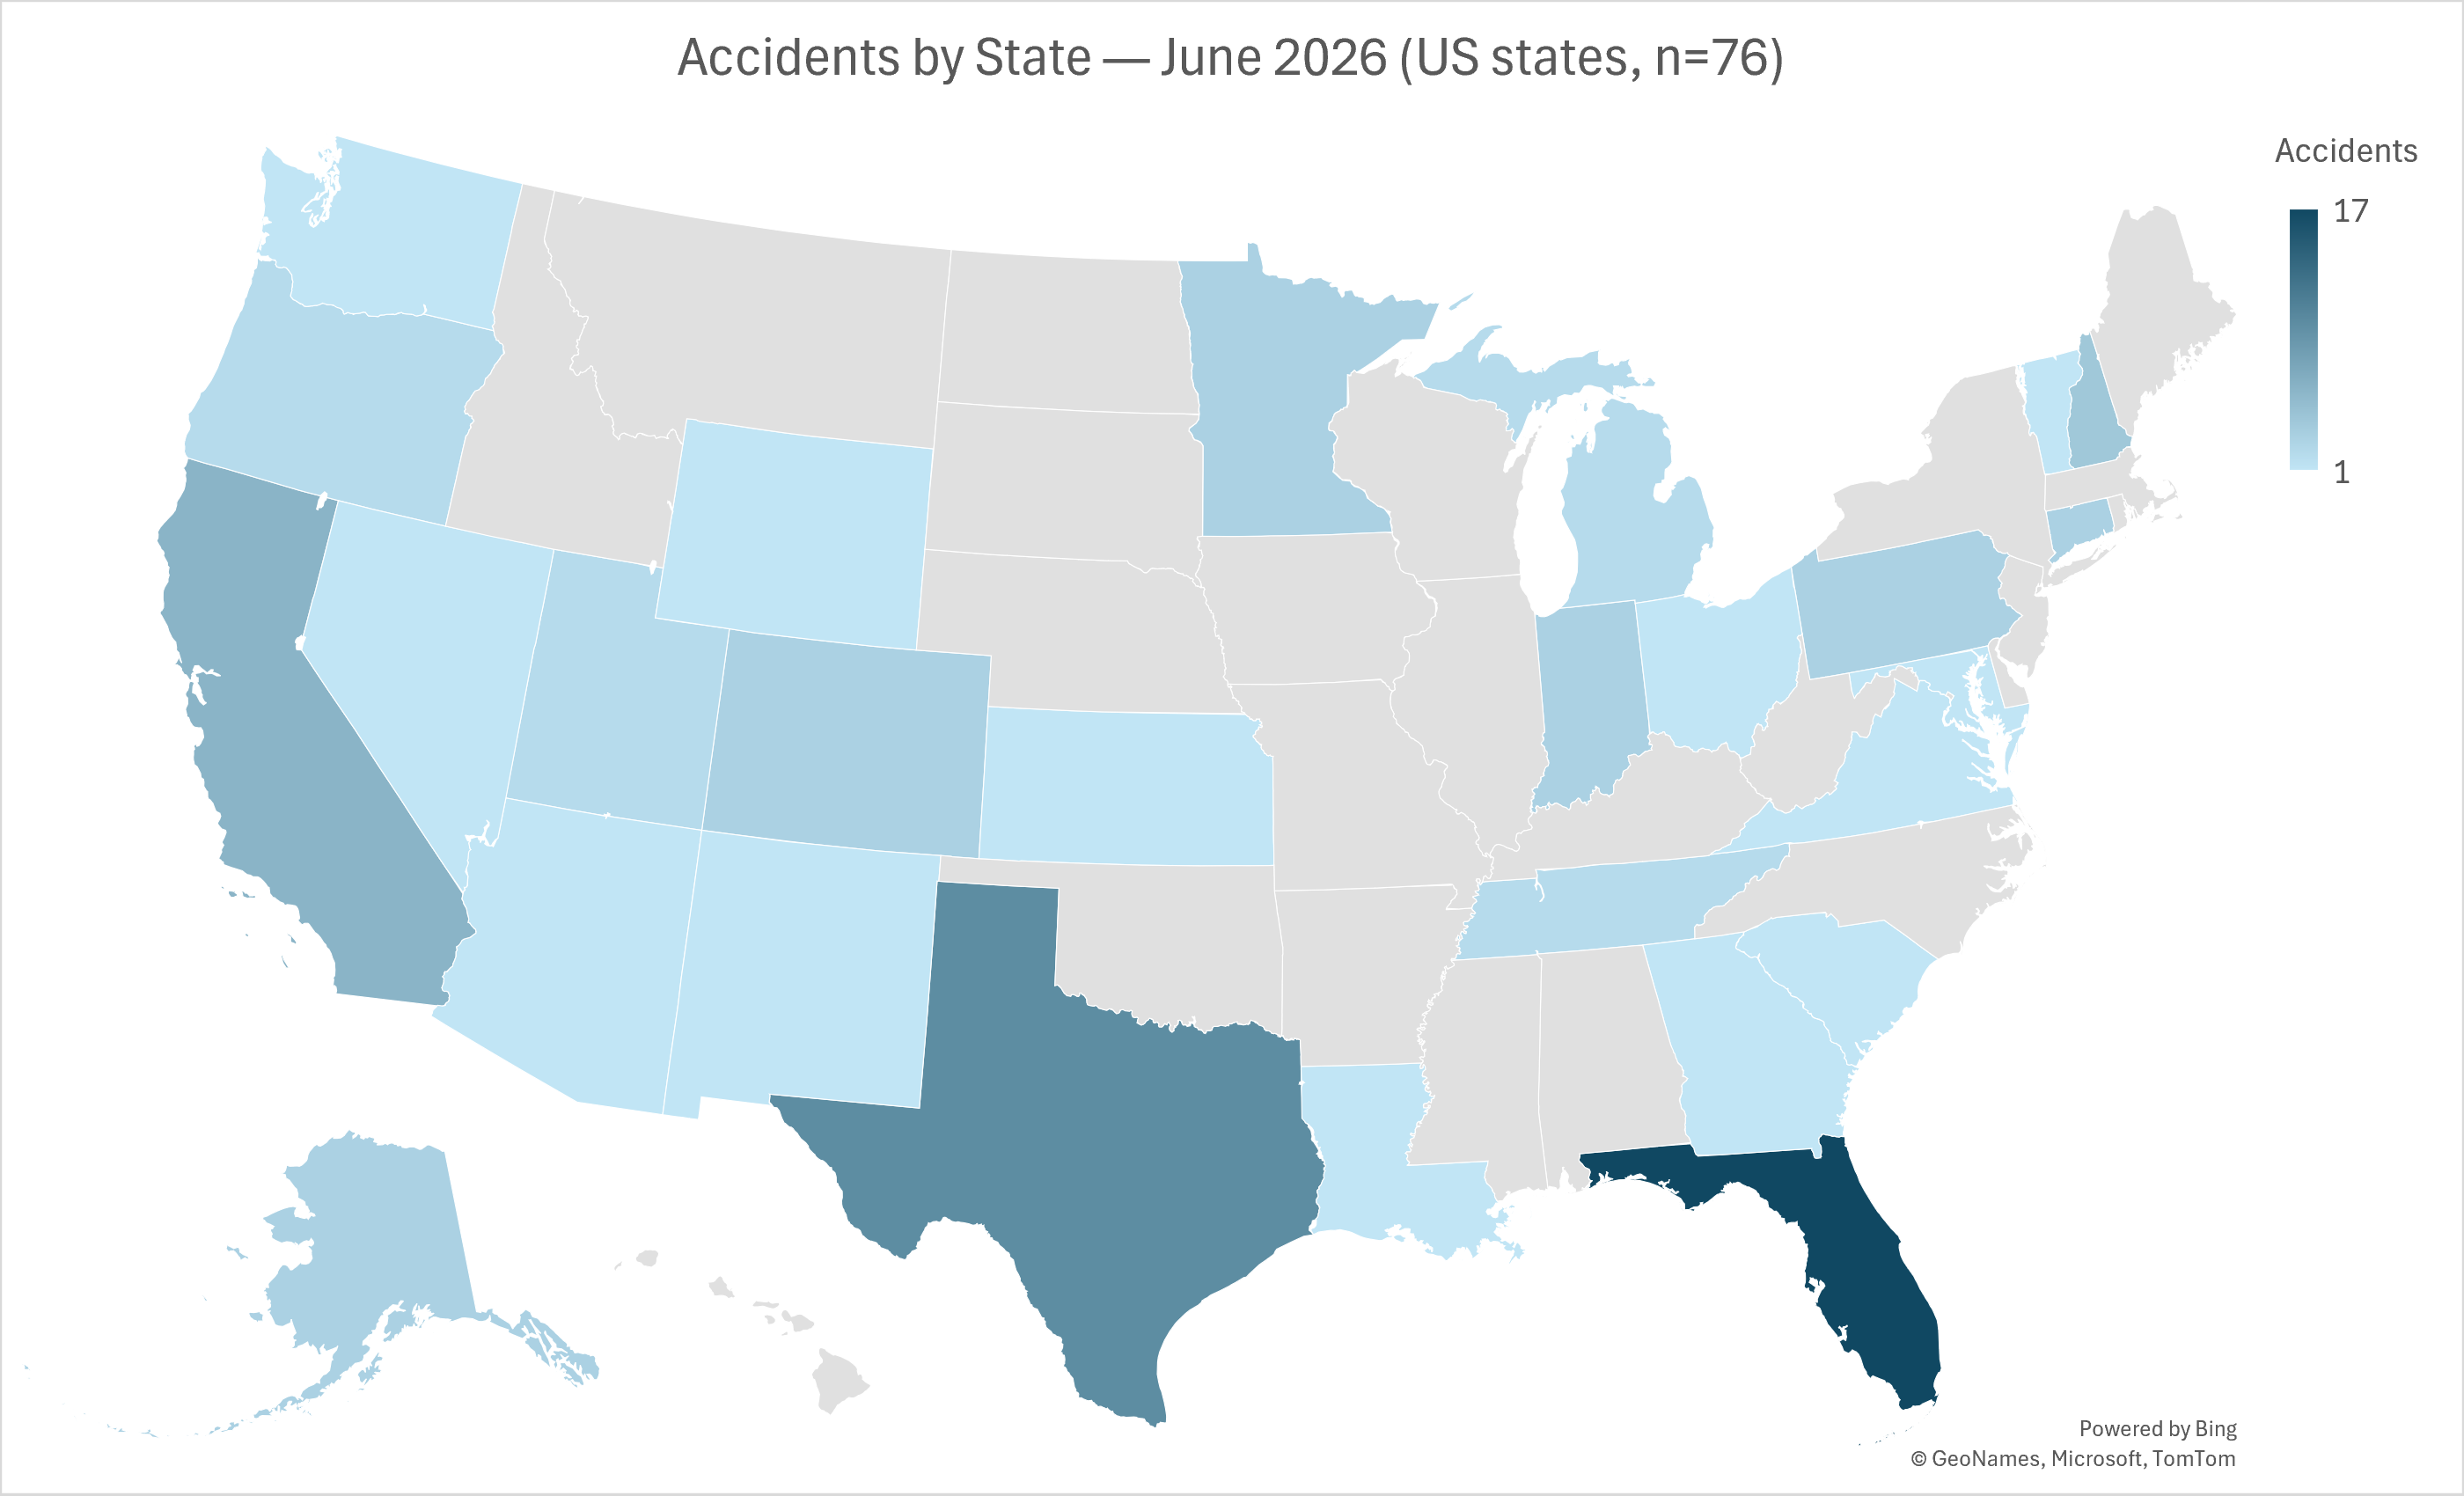
Where Are They Happening?
No surprise here: Texas and Florida dominate the map. Both states have a massive concentration of flight training activity, which is the biggest driver. This isn’t a knock on those states—it’s a reflection of where the student pilot population is highest. More flying hours means more exposure.
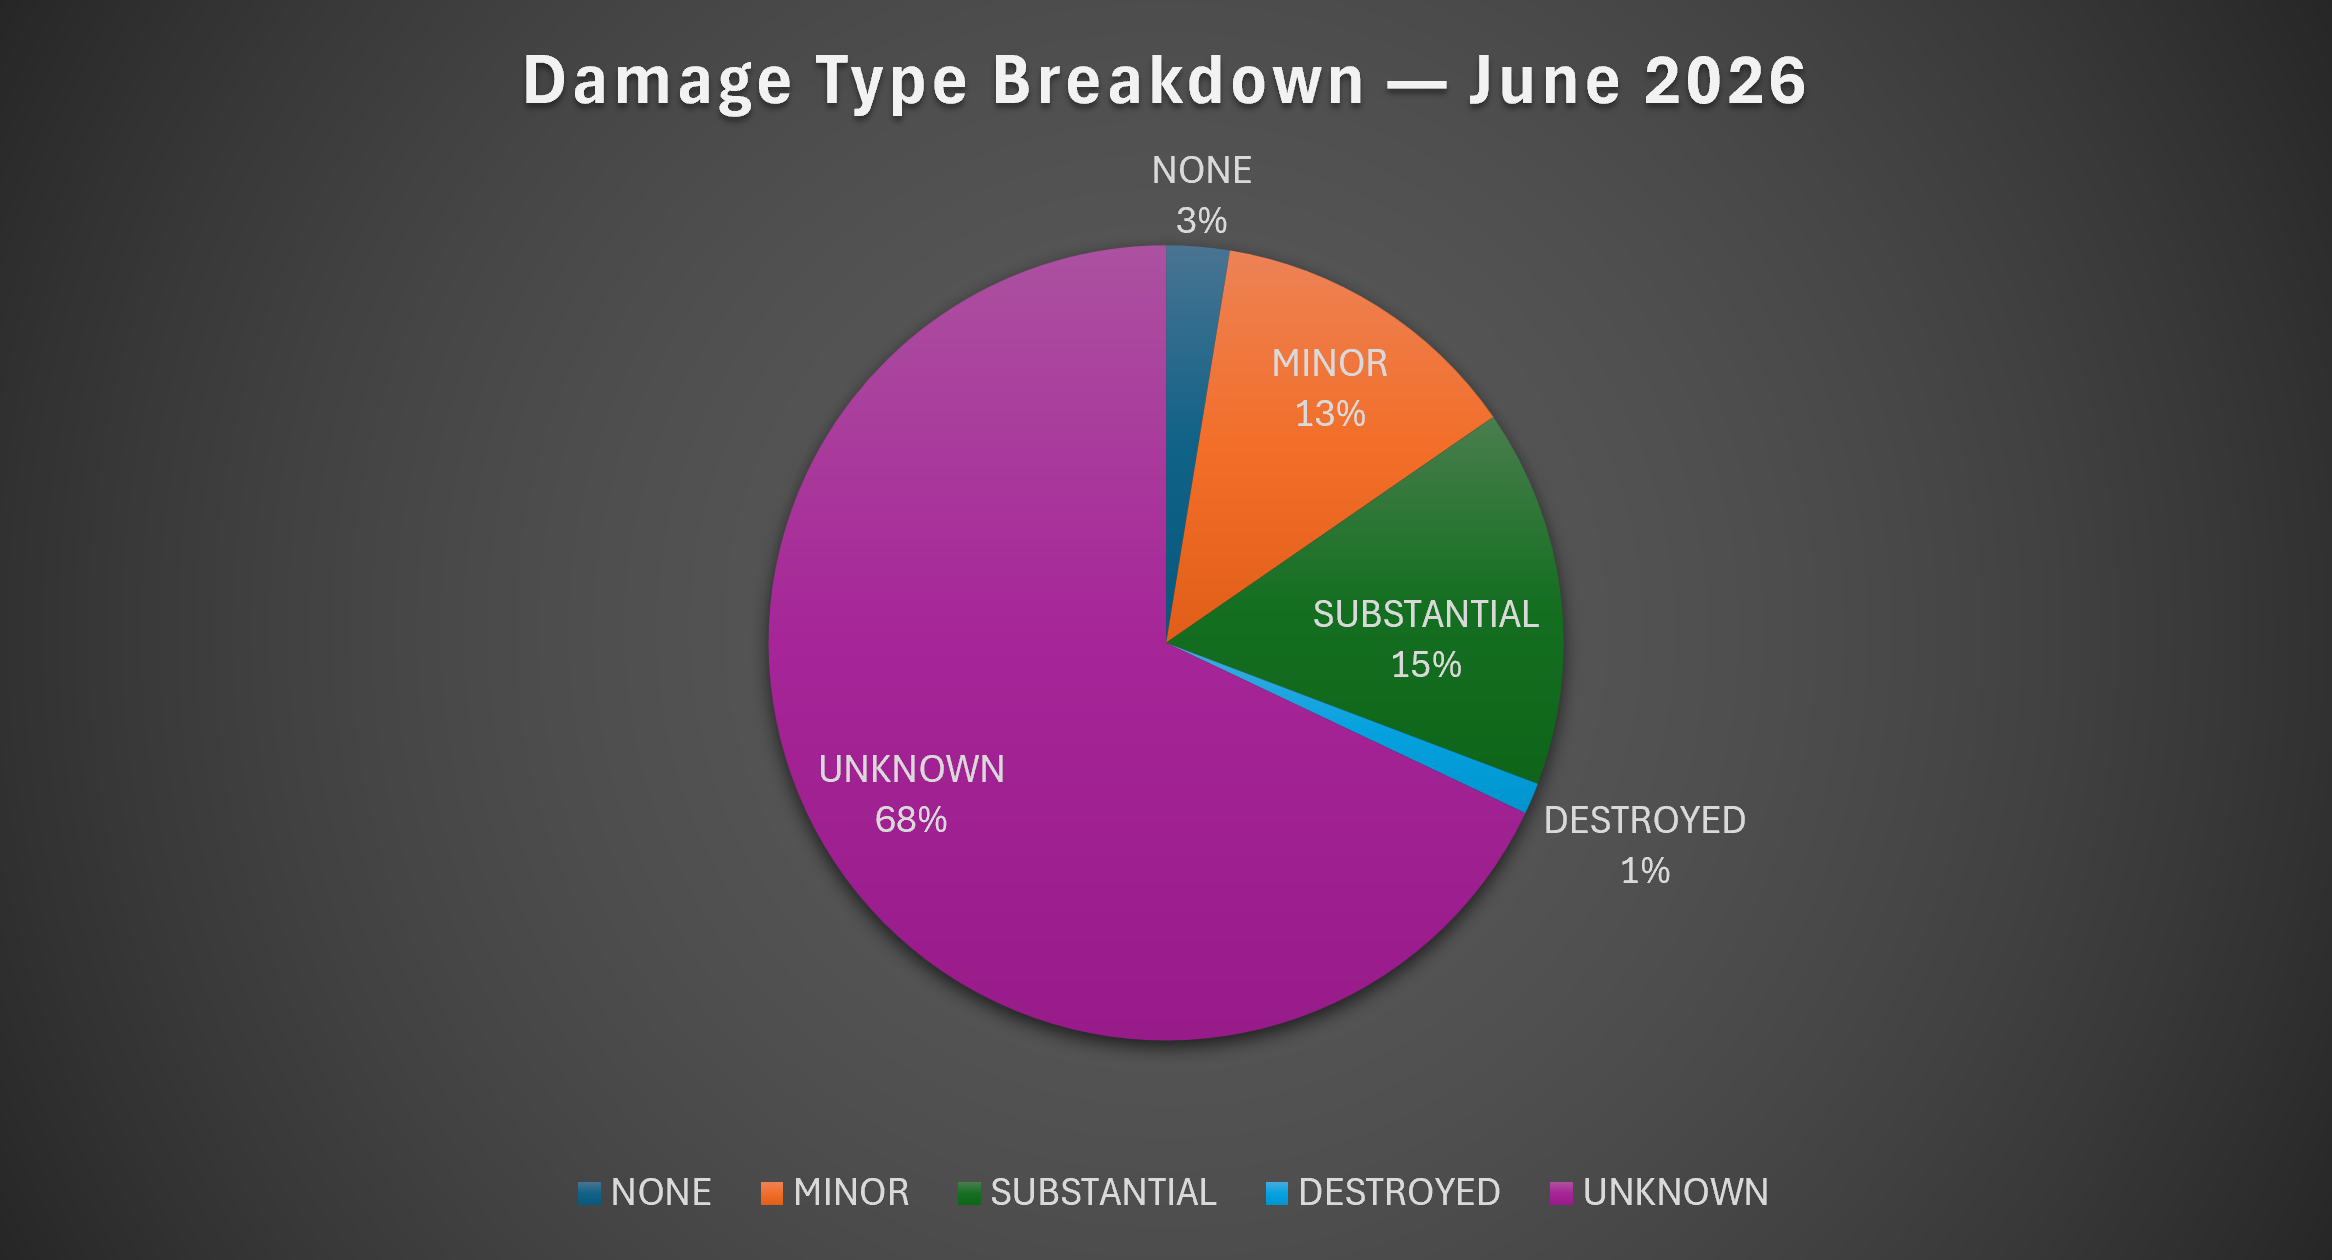
How Bad Is the Damage?
The damage breakdown chart has one big caveat: 68% of reports are still showing “unknown” damage status. That’s normal for preliminary data—these reports come in fast and get filled out over time. Of the cases where damage is known, the split between substantial/destroyed and minor/none is essentially equal.
The Most Important Chart: Phase of Flight
This is the one that matters. Nearly 80% of all accidents in this period happened during the takeoff or landing phase of flight—and that includes touch-and-goes. Landing alone accounts for 51.3% of the total. That’s not a new trend. Loss of control on landing has been one of the top accident causes in U.S. general aviation for years, and it’s almost always preceded by an unstabilized approach.
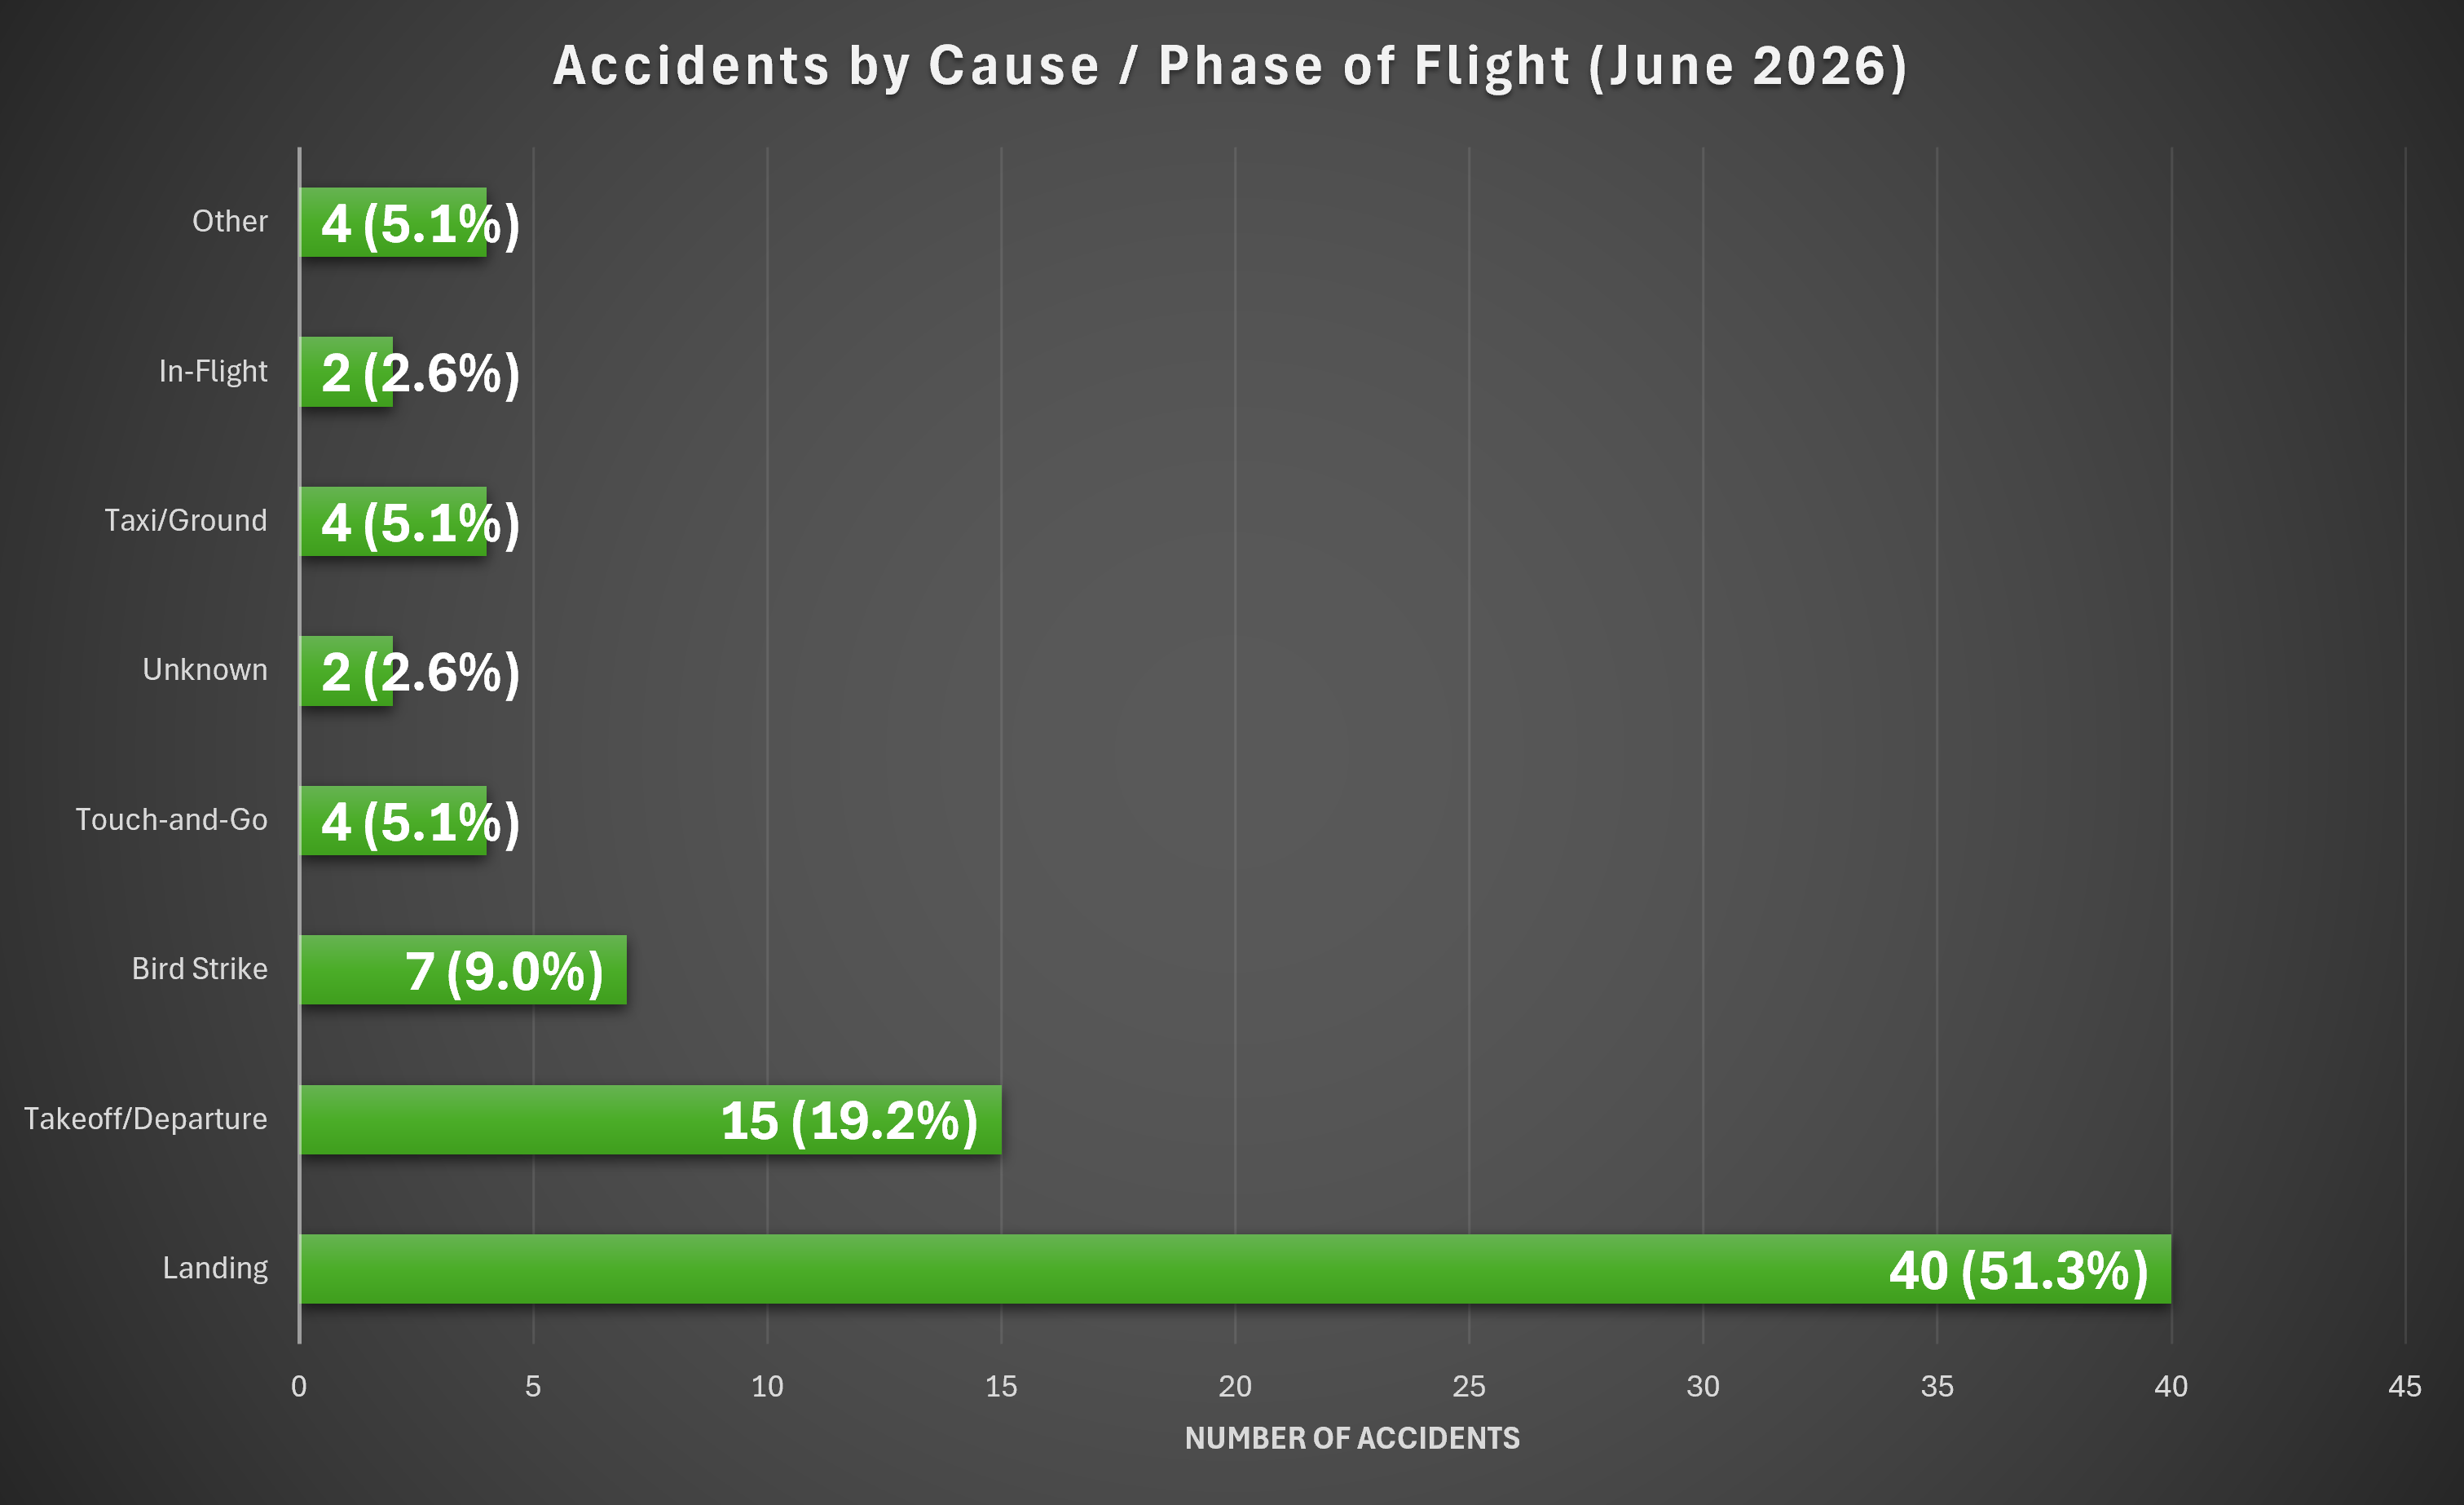
The takeaway: Unless you’re dealing with a forced landing situation, a go-around is always an option. Stabilized approach. Correct airspeeds. Centerline discipline. If something doesn’t feel right on final, go around—every time, without negotiation.
What a DPE Watches For
Takeoff and landing share a common problem: you’re slow, close to the ground, and running out of options if something goes wrong. The maneuver I use as a checkride predictor for landing quality is slow flight. Applicants who are uncomfortable in slow flight almost always struggle with landings—because landing is slow flight, just with the goal of getting the airplane onto the runway. I’m watching for coordination, timely control inputs, and a pilot who looks calm and in control. If an applicant looks mildly panicked at slow airspeeds in the practice area, I already know what the landing traffic pattern is going to look like.
The other major factor is keeping the longitudinal axis of the aircraft aligned with the centerline. Landing in a crab isn’t just an ugly touchdown—it can start a chain of events that ends with the aircraft departing the runway. Newer pilots are especially prone to fixation: locked onto the airspeed indicator, or fixated on a single aimpoint, and completely forgetting about alignment. If that’s happening consistently, the answer is straightforward—more practice.
As you move through the round-out and into the flare, your scan needs to shift outside the cockpit. Peripheral vision is your best tool for alignment and pitch attitude at that point. If the approach was stabilized, the airspeed will take care of itself. Your attention needs to be on centerline control, aircraft alignment, and managing pitch—not hunting for numbers on the instrument panel.
Look at the Data Yourself
The FAA publishes preliminary accident and incident data updated regularly. It’s worth bookmarking and checking periodically.
FAA Preliminary Accident & Incident Data:
FAA AVIATION SAFETY INFORMATION ANALYSIS AND SHARING (ASIAS) SYSTEM
Data reflects FAA preliminary reports filed June 1–11, 2026. Preliminary reports are subject to revision as investigations progress.